Introduction to EMC's methods for testing power port disturbance voltage measurements
 Data:2022-09-19
 Click:4760


Data:2022-09-19
Click:4760
In EMC test, a complete measurement conclusion shall be composed of measured observation value and uncertainty of measurement result. According to its identification method, it can be divided into uncertainty A, and B can be divided into uncertainty caused by random error and uncertainty caused by system error according to different characteristics of deviation. Type A uncertainty cannot simply correspond to the uncertainty caused by random error, while type B uncertainty corresponds to the uncertainty caused by system error. A The uncertainty evaluated by the observation column statistical analysis is expressed by the experimental standard deviation S; Category B is different from the uncertainty of observation column statistical analysis and evaluation, and has the application experience or data of previous observation data and measurement instrument characteristics, as well as the possible standard deviation performance of assumed probability distribution. According to the research on the uncertainty of laboratory test items, it plays a positive role in improving the laboratory test ability and ensuring the test quality.
1. Power port disturbance voltage measurement
The measurement of disturbance voltage at the power supply port consists of line impedance stability (LISN) and EMI test receiver. The 50 ohm impedance of LISN standard measures the disturbance voltage within the given frequency range, and makes the EUT and the power supply protect each other. The measurement plan is shown in Figure 1.

2. Origin of uncertainty
In EMC testing, there are many factors that lead to measurement uncertainty. When looking for the source of uncertainty, we can comprehensively consider the measurement instrument, measurement environment, measurement personnel, measurement method, measurement, etc. Therefore, the sources of uncertainty in the measurement of the disturbance voltage at the power supply port include: the system measurement repeatability, the receiver pulse range, the uncertainty caused by the pulse repetition frequency response, the LISN receiving partial voltage index, the uncertainty caused by the receiver, the LISN measurement environment and the laboratory layout, and the mismatch between the intermediate impedance of the equipment to be tested.
The calculation method of Class A uncertainty is developed from the calculation method of random error. Its permeability is expressed by calculating the test standard deviation. Therefore, the key uncertainty weight reflecting the random error generally adopts the Class A identification method, and generally adopts the Bessel calculation formula. Non-statistical methods are used to identify Class B uncertainty, and according to experience or relevant technical information and data, the probability distribution k of the possible value (a, - a) of the weight to be measured from the standard confidence level P and the measured value including factors to the possible range, which may be the standard deviation u (xi)=ak, and the relationship between k and the distribution is shown in Table 1.

3. Mathematical modeling and uncertainty identification
In many cases, the measured Y (output) cannot be measured directly, but N weights X1, X2,..., XN According to the function relationship f, when Xi has a certain probability distribution, the meaning of the symbol is random variable 10. If the predicted value of measurement Y is y and the predicted value of input Xi is xi, then y=f (X1, X2,..., XN), the uncertainty of Y generation specification is as follows:
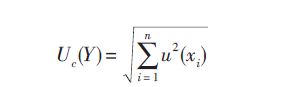
Where, U (xi) is the uncertainty of input xi specification.
The uncertainty of Y expansion is as follows: U (Y)=kUc (Y), k includes factors.
According to the source of uncertainty of power port transmission disturbance, the measurable V can be calculated as follows:
![]()
3.1 System measurement repeatability
The uncertainty caused by systematic measurement repeatability Vr is determined according to the Class A identification method, and the uncertainty caused by random error is expressed by the standard deviation s (x -) of the mean test.
The laboratory data test at the frequency of 0.25MHz is shown in Table 2, and the disturbance voltage of the power terminal N line is measured separately for 6 times.

Then calculate the average value x as:

3.2 Pulse amplitude
Uncertainty caused by pulse amplitude δ Vpa, according to the instrument operation guide, the receiver sine wave voltage measurement deviation δ 11 "1.5dB, corrected value δ The predicted value of Vpa is 0, and the half-width is 1.5dB square spread.
3.3 Pulse repetition frequency response
Uncertainty caused by pulse repetition frequency response δ Vpr, receiver pulse voltage measurement deviation CISPR16-1 specification, corrected value δ The predicted value of Vpr is 0, and the half-width is 1.5dB square spread.
3.4 Partial voltage index of human power network
The voltage partial pressure index Lamn of the human resource network (LISN) can be obtained from the instrument calibration report, and the half-width is 0.5dB normal distribution.
3.5 Impedance mismatch
Uncertainty caused by mismatch of intermediate impedance between receiver and LISN δ The corrected value of M is:
![]()
![]()
Where: Γ R is the reflection coefficient of the receiver; by Γ E Reflectance coefficient from LISN port when receiving the measured object; S is the S parameter of the receiver and LISN two-port network.
Specific measurement δ M This is impossible, but it can be determined that the maximum value will not exceed the specified value δ M±:

3.6 Measurement environment
Uncertainty caused by measurement environment δ C. It includes the influence of ambient temperature and humidity and ambient noise level, but the working atmosphere of the laboratory generally meets the requirements of the regulations, which is basically harmless to the measurement conclusion and can be ignored.
3.7 Survey layout
Uncertainty caused by laboratory measurement layout δ S. The standard requires the experiment to be measured when the most typical operating state of the object to be measured causes large disturbance. Therefore, in the process of testing, the factor of stable operation of the object to be tested under typical operating conditions cannot be considered.
4. Description of measurement conclusion
The application of VrA identification method for power port transmission disturbance uncertainty source is clear, and other factors of B identification method are clear, and their origin is irrelevant. In general, the generation specification uncertainty formula described in Section 3 can measure the generation uncertainty:

A complete measurement conclusion should include two basic quantities, one is the excellent predicted value of the measurement, usually the arithmetic mean value of the data measurement; The other is to describe the permeability of the measurement conclusion, that is, the uncertainty of the measurement. Therefore, the disturbance voltage value VN=59.37dB at 0.25MHz power supply terminal μ 5. Its expanded uncertainty is U=2.76dB, including factor k=2 and confidence level p=95%
5. Conclusion
According to the requirements of CNAS standards, the laboratory power terminal disturbance voltage is detected as 4dB. After analysis, the laboratory measurement uncertainty meets the requirements, and the measurement conclusion is stable. The uncertainty of receiver noise bottom, measurement layout and other factors are not considered, and further EMC test analysis is required.